How to Interpret the Report
Most outcomes are presented as average (mean) values for your group. For example, if you look at the sample result below, you will see that the average value for the “How interconnected you are with others?” item was 73.4 before the workshop and was 90 after the workshop.
EXAMPLE:
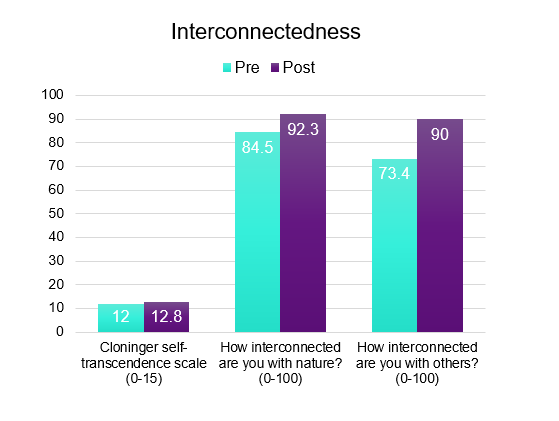
You can look at the average values and see if they went up or down after your workshop. For example, if the pain scores went from 5.0 before to 2.0 after, you would understand that participants had pain symptoms decreased from the workshop. In our interconnectedness example above we see that the score increased by 16.6 points towards greater interconnectedness with others, which is in the direction that we would like.
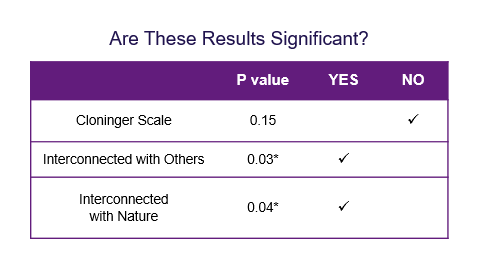 If the measure was completed before and after your event, you will see a p-value calculating the statistical difference between the pre- and post-values. You want to see this value be below 0.05 which will be marked with an asterisk*. This means that statistically speaking there is a 95% likelihood that the difference you are seeing actually does exist and is not due to chance. The p = 0.05 is the common cut-off used for scientific studies. The lower the p-value, the more confident you can be in the change. In the self-transcendence example above, we see a p-value of 0.01. This means that we are 99% sure that the difference between the pre- and post-values are not due to chance.
What if none of my measures have a p-value less than 0.05?
If the values are moving in the right direction but the p-value is greater than 0.05 that may mean that you did not have enough participants for statistical power to detect a change in the pre-post values. The more participants you have taking the measures, the more confident you can feel of the results you are seeing. It may also mean that your workshop does not affect that factor in the way we are measuring it. This information can help you refine your workshop so that you are achieving the outcomes you are intending with your participants.
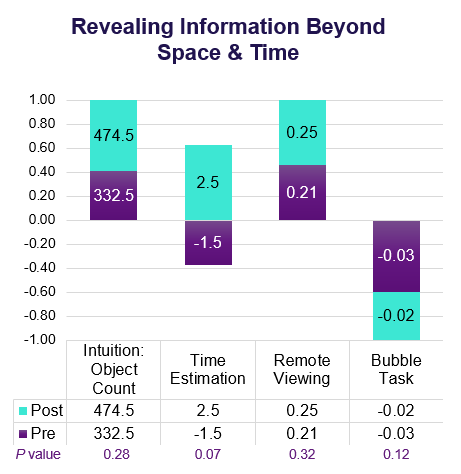
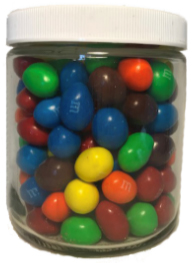 The Object Counting Task investigates intuition. “Intuition is the ability to understand immediately without conscious reasoning and is sometimes explained as a ‘gut feeling’ about the rightness or wrongness of a person, place, situation, temporal episode or object.”4 The participant is presented with a picture of a jar containing items. The image is displayed very briefly such that they are not able to consciously count the number of items. The participant guesses how many items they believe are in the jar. The participants are shown different images at their pre- and post-assessments. The values recorded in the example table below are the deviations from the correct answer for each jar with smaller scores being more accurate.
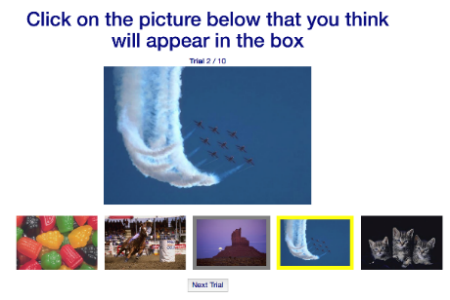 Remote viewing is a mental faculty that allows a perceiver to describe or give details about a target that is inaccessible to normal senses due to distance, time, or shielding. For this task, a blank frame is displayed in the center of the screen, and five photos are displayed below it. The participant chooses which of the five images they think will appear in the blank space. The participant completes 10 trials. The values listed in the example table below represent the percent correct.
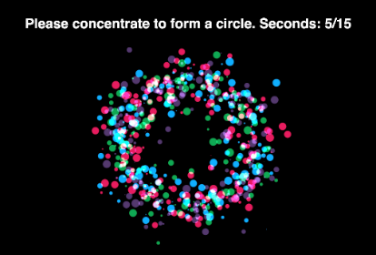 The bubble task is a psychokinetic task. Small bubbles are moving on the screen and the participant is asked to concentrate to make the bubbles form a circle for 15 seconds. The participants then relax for 15 seconds. The movement of the bubbles to form a circle is linked to a random number generator. The normal function of the random number generator results in a value of zero for this task. If the participant is able to affect the random number generator, then their values would deviate away from zero in either a positive or negative direction. The values listed in the example table below represent the deviation from zero. Greater numbers represent a greater psychokinetic effect.